Platform · Reports
See what is making and losing money
Eleven built-in reports cover quality, unsold leads, routing, fraud, timing, demand, caps, overlap, voids and sudden changes. Group the numbers any way you need, and export any table.
What you can do
Reports, in plain words.
- Break results down by day, publisher, buyer offer, source, campaign, flow or country
- See which kinds of lead nobody bought, so you know which buyers to find
- Get alerts when a number changes suddenly
Accept rate by hour and weekday
In detail
Which numbers matter?
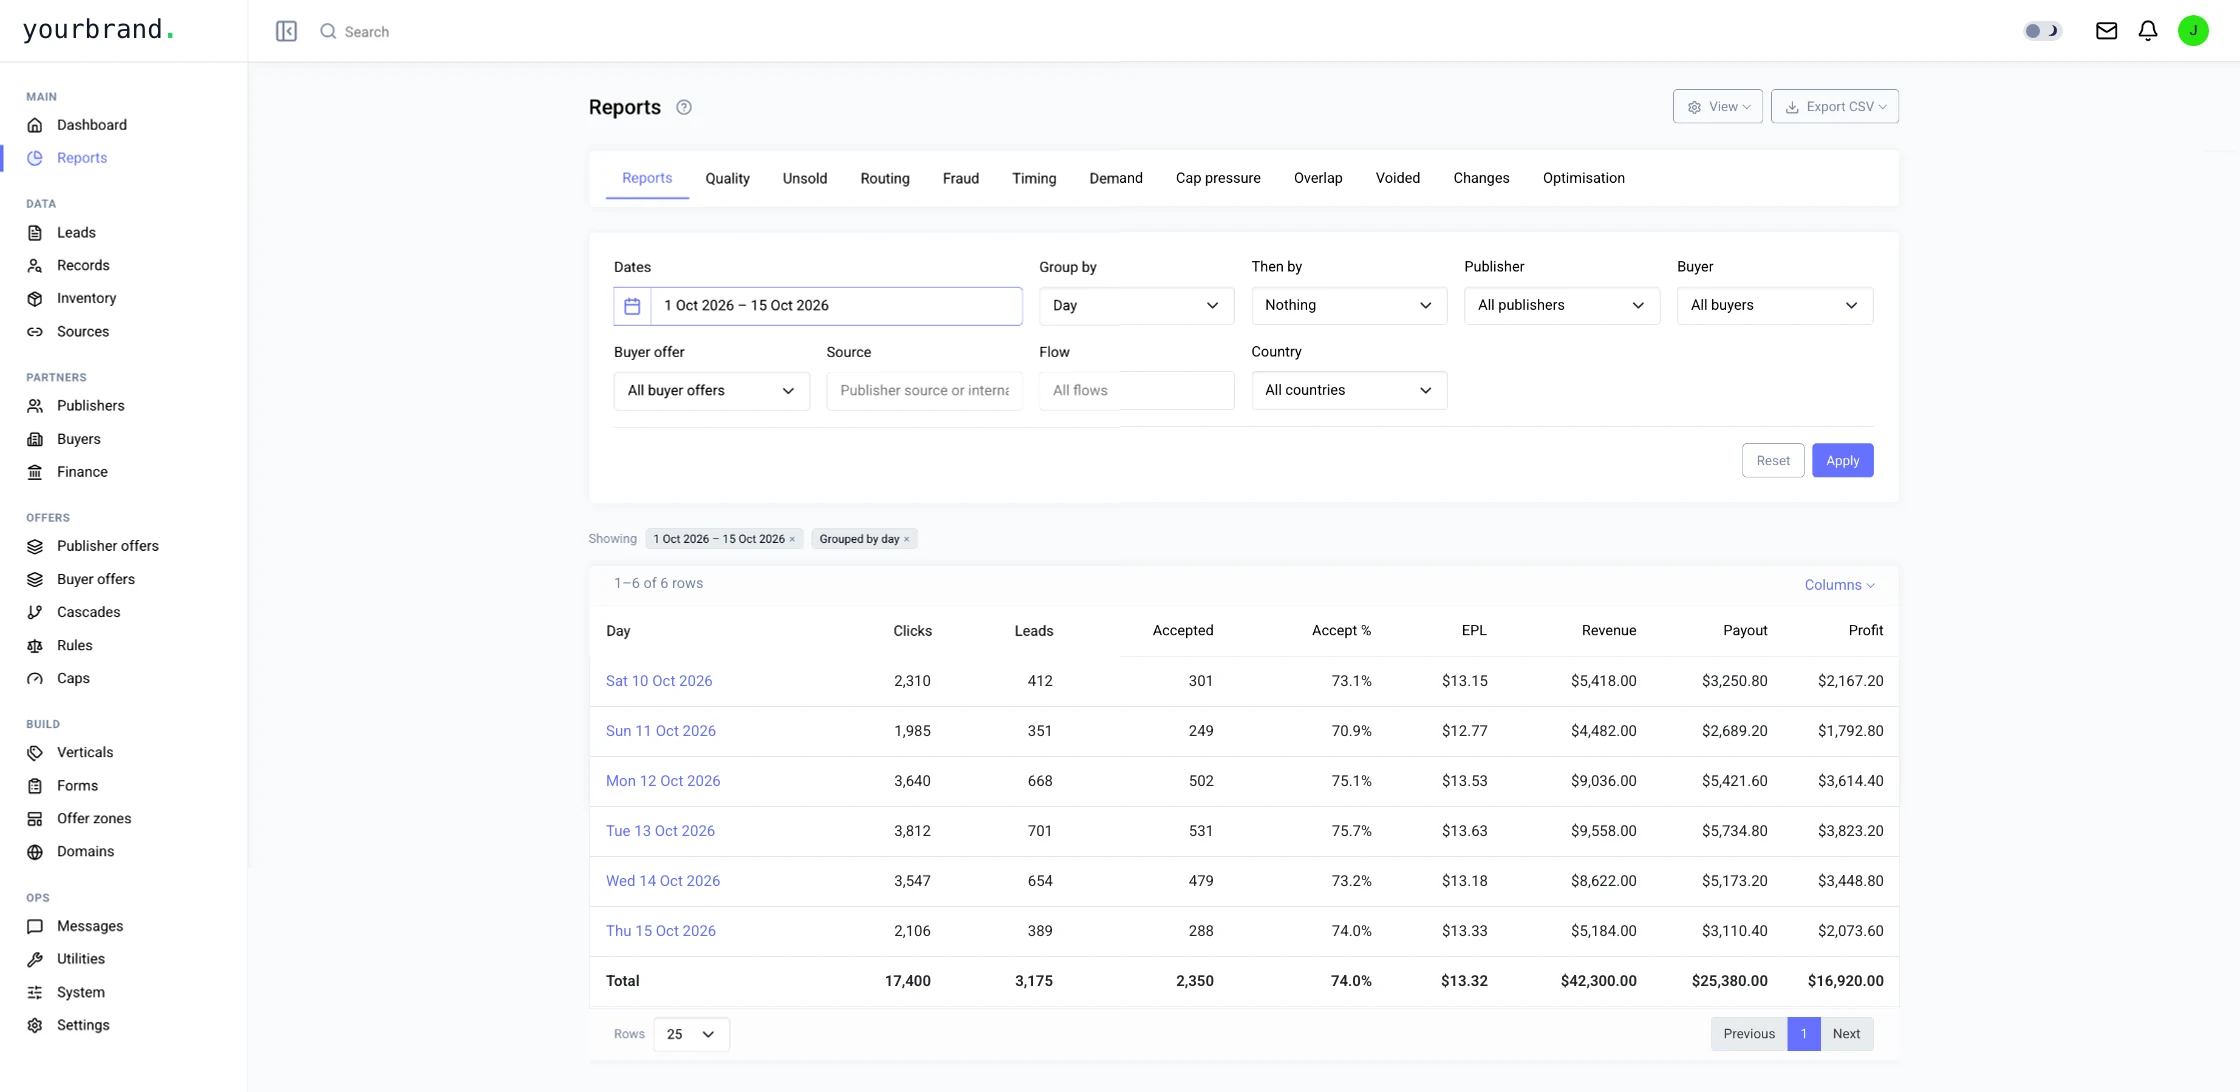
A lead business lives on a few numbers: how many clicks became leads, how many leads sold, what each lead earned, and what is left after you pay publishers. The main report shows clicks, leads, accepted, accept rate, earnings per lead, revenue, payout and profit, and lets you group them by day, week, month, publisher, buyer offer, source, campaign, flow, country or position.
The other ten reports answer the next question: why. Why did leads go unsold? Which buyer is full early in the day? Which hour accepts best? Which publisher sends the same people as another?
- 1
Pick a report
Start with the main report, then open Quality, Unsold, Routing, Fraud, Timing, Demand, Cap pressure, Overlap, Voided or Changes.
- 2
Group it
Choose how to group the results, and add a second grouping if you need one.
- 3
Filter it
Narrow it to one publisher, buyer, offer or country, over any date range.
- 4
Export or alert
Download any table as a CSV, and set up alerts for sudden changes.
Inside the product
This is Reports in pingtype.
You decide
What you control in Reports.
- The date range
- How results are grouped, and a second grouping
- Which publisher, buyer or offer to look at
- Which columns show, including your own custom columns
- Which conversion events count
- Where alerts are sent
Questions
Can I add my own columns?
Yes. You can add up to twelve custom columns to your reports, based on your own conversion events.
Can I export a report?
Yes. Every table has an Export CSV button.
What is the Demand report?
It shows the kinds of lead nobody bought, by state, and what those leads are worth on average, so you know which buyers to look for.
What does the Timing report show?
The accept rate for every hour of every weekday, so you can see when buyers take the most leads.
Works with
Reports fits with the rest of pingtype.
More of the platform